
Poleplan: Basics#
The following example demonstrates how a poleplan object can be created from a system object.
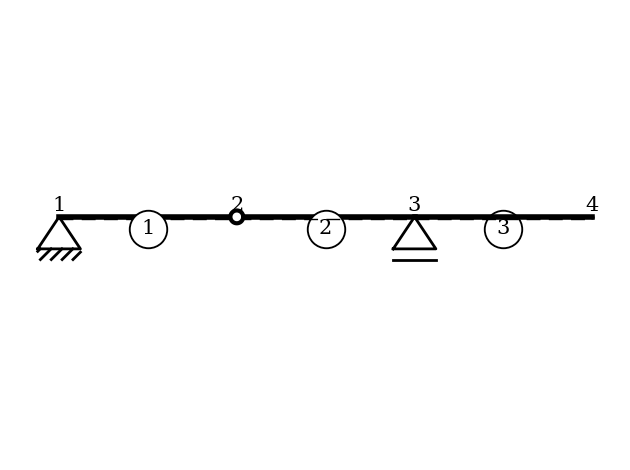
We will use System-object that was modeled in the example “Identifying an Unstable System”.
Finally, the poleplan is visualized.
You can find the example as an executable Python file here.
Import Modules#
We start by importing the required classes for defining and visualizing the poleplan.
[1]:
from sstatics.core.preprocessing import (Node, Bar, Material, CrossSection, System)
from sstatics.core.solution import Poleplan
from sstatics.core.postprocessing.graphic_objects import ObjectRenderer, SystemGeo
Define System#
In this step, we will use System-object that was modeled in the example “Identifying an Unstable System”.
[2]:
# define cross-section
c_1 = CrossSection(mom_of_int=2769, area=76.84, height=20, width=10, shear_cor=0.1)

# define material
m_1 = Material(young_mod=21000, poisson=0.1, shear_mod=8100, therm_exp_coeff=0.1)

# define Node
node_1 = Node(0, 0, u='fixed', w='fixed')
node_2 = Node(200, 0)
node_3 = Node(400, 0, w='fixed')
node_4 = Node(600, 0)

# define Bar
bar_1 = Bar(node_1, node_2, c_1, m_1, hinge_phi_j=True)
bar_2 = Bar(node_2, node_3, c_1, m_1)
bar_3 = Bar(node_3, node_4, c_1, m_1)

bars = [bar_1, bar_2, bar_3]

# define System
system = System(bars)

# Visualize system
ObjectRenderer(SystemGeo(system, show_bar_text=True), 'mpl').show(show_axis=False)
Define Poleplan#
The poleplan can be accessed directly as an attribute of the System class:
[3]:
poleplan = Poleplan(system=system)
Visualize Poleplan#
Poleplan using the plot() method of th class.[4]:
poleplan.plot()
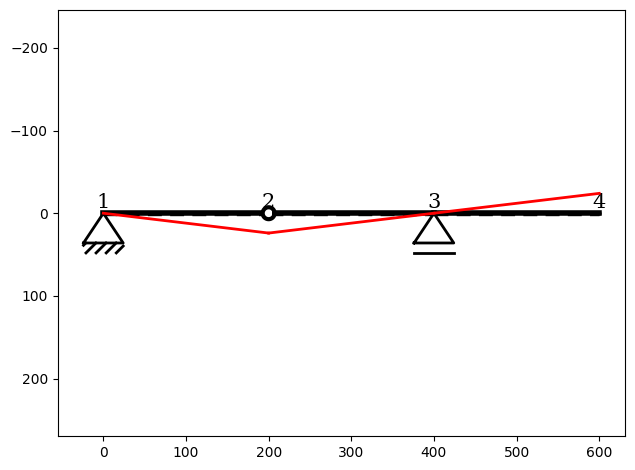
The kinematic chain consists of two chains:
Chain 1 (shown in purple) has its absolute pole at Node 1 (0, 0).
Chain 2 (shown in yellow) has its absolute pole at Node 3 (0, 400).
The relative pole (1|2) is located at Node 2 (0, 200).